")
")
Understanding the "DIAGRAM"!
THE DIAGRAM
The diagram represents a complete breathing cycle. Obviously, it starts from the zero value and with the beginning of the breathing-in it moves to negative values because, as we know, a depression is needed to trigger the delivery.
Over the years, manufacturing companies, in an effort to improve performance, have sought to minimise the breathing effort to make diving safer and more enjoyable. As a matter of fact, the delivery system must not force the diver to suck in the air, but must instead "offer it" according to requirements and without calling for any great effort.
Looking at the diagram more carefully, we notice that the values tend to rise with the entry into play of the Venturi effect, an effect which can take the diagram to slightly positive values. In the second part, all positive, we see the increase in internal pressure due to effort for breathing out.
Legislation requires that peak respiratory pressure during inhalation and exhalation must be between +25 mbar and -25 mbar, and that during the inhalation the maximum positive pressure, if present, must not be greater than 5 mbar (and a maximum work of 0.3 J/l). Furthermore, the respiratory work of an entire cycle must not be greater than 2.5 J/l.
With good approximation we can consider the respiratory work proportional to the surface marked by the curve. The work associated with positive pressures during inhalation should not be considered in the calculation of total respiratory work.
The significance of all these data is simply that the regulator must provide air to the diver even in extreme conditions (almost empty cylinder, high depth, extreme shortness of breath) without ever interrupting operation. Standards call for a limit of 5 mbar for the Venturi effect to prevent excess air from causing the diver to panic. Let's analyse some more cases:
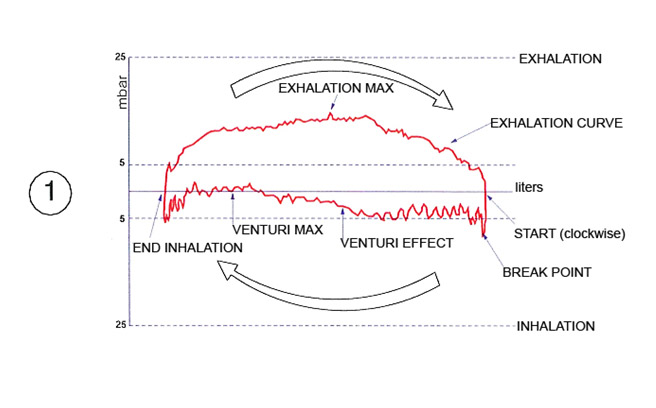
In diagram (1) we see a regular test: we notice how the work of breathing-in is much less than the work of breathing-out.
REGULATOR PERFORMANCE
| TEST CONDITIONS | RESULTS | ||
| Water temperature | 3 C° | Inhalation pressure | 8.71 mbar (Limit=25 mbar) |
| Exhaled air temperature | 24 C° | Inhalation positive pressure | 1.86 mbar (Limit=5 mbar) |
| Pressure supplied | 50/53 bars (static/dynamic) | Exhalation pressure | 14.39 mbar (Limit=25 mbar) |
| Inhalation volume | 2.48 liters | Total one cycle work | 1.31 Joules/liters (Limit=2.5 J/l) |
| Complete breathing cycle | 25.12 rpm | Inhalation work | 0.27 J/l |
| Total ventilation | 62.2 liters/min | Positive inhalation work | 0.01 J/l (Limit=0.3 J/l) |
| Exhalation work | 1.04 J/l | ||
pressURe / Volume Diagram AT THE DEPTH OF 50.5 metERS
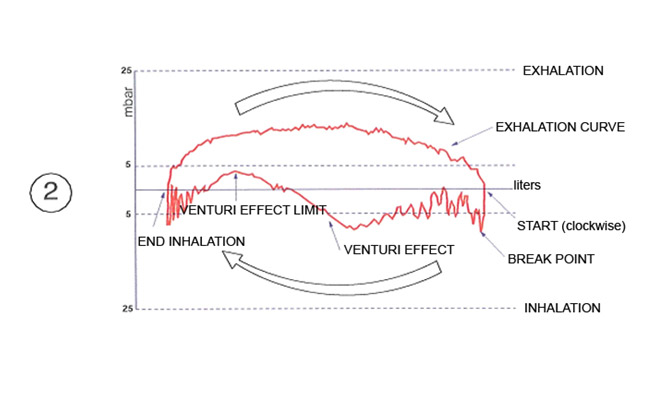
In diagram (2) the Venturi effect is just below the accepted maximum limit.
REGULATOR PERFORMANCE
| TEST CONDITIONS | RESULTS | ||
| Water temperature | 3 C° | Inhalation pressure | 8.91 mbar (Limit=25 mbar) |
| Exhaled air temperature | 24 C° | Inhalation positive pressure | 4.31 mbar (Limit=5 mbar) |
| Pressure supplied | 50/53 bars (static/dynamic) | Exhalation pressure | 14.19 mbar (Limit=25 mbar) |
| Inhalation volume | 2.48 liters | Total one cycle work | 1.37 Joules/liters (Limit=2.5 J/l) |
| Complete breathing cycle | 25.14 rpm | Inhalation work | 0.30 J/l |
| Total ventilation | 62.2 liters/min | Positive inhalation work | 0.07 J/l (Limit=0.3 J/l) |
| Exhalation work | 1.06 J/l | ||
pressURe / Volume Diagram AT THE DEPTH OF 50.5 metERS
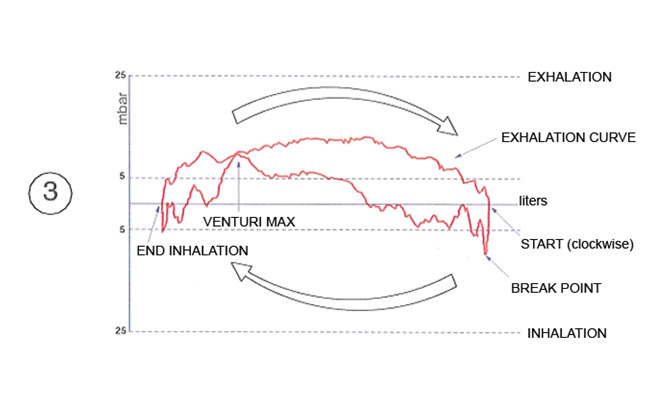
In diagram (3) the Venturi effect is out of limits.
REGULATOR PERFORMANCE
| TEST CONDITIONS | RESULTS | ||
| Water temperature | 3 C° | Inhalation pressure | 9.79 mbar (Limit=25 mbar) |
| Exhaled air temperature | 24 C° | Inhalation positive pressure | 10.18 mbar (Limit=5 mbar) |
| Pressure supplied | 50/54 bars (static/dynamic) | Exhalation pressure | 13.22 mbar (Limit=25 mbar) |
| Inhalation volume | 2.48 liters | Total one cycle work | 1.08 Joules/liters (Limit=2.5 J/l) |
| Complete breathing cycle | 25.14 rpm | Inhalation work | 0.11 J/l |
| Total ventilation | 62.2 liters/min | Positive inhalation work | 0.29 J/l (Limit=0.3 J/l) |
| Exhalation work | 0.97 J/l | ||
pressURe / Volume Diagram AT THE DEPTH OF 50.5 metERS
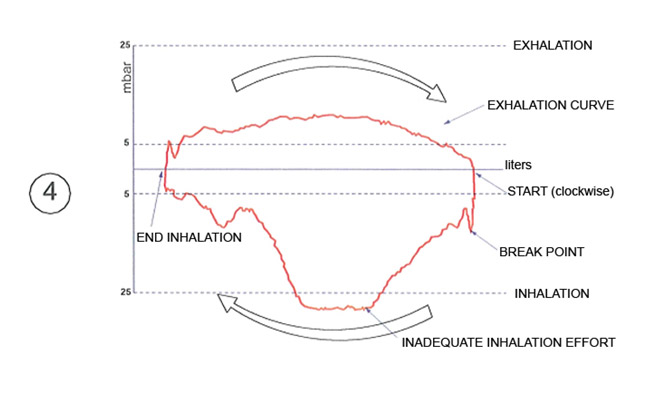
In diagram (4) the breathing-in effort is out of limits.
REGULATOR PERFORMANCE
| TEST CONDITIONS | RESULTS | ||
| Water temperature | 18.3 C° | Inhalation pressure | 28.67 mbar (Limit=25 mbar) |
| Exhaled air temperature | 18.2 C° | Inhalation positive pressure | 0.00 mbar (Limit=5 mbar) |
| Pressure supplied | 50/51 bars (static/dynamic) | Exhalation pressure | 11.72 mbar (Limit=25 mbar) |
| Inhalation volume | 2.48 liters | Total one cycle work | 2.52 Joules/liters (Limit=2.5 J/l) |
| Complete breathing cycle | 25.13 rpm | Inhalation work | 1.67 J/l |
| Total ventilation | 62.2 liters/min | Positive inhalation work | 0.00 J/l (Limit=0.3 J/l) |
| Exhalation work | 0.85 J/l | ||
pressURe / Volume Diagram AT THE DEPTH OF 50.5 metERS